Corepoint Integration Engine presents a historical view of connections and system information. Using the data, users can quickly determine what events may be influencing the performance and effectiveness. Common events include an increase in message volume or increase in number of connections.
The detailed metrics allow users to be proactive, rather than react after negative situations occur, helping users:
- Run historic reports and statistical queries for any length of time (2 hours, 2 weeks, 2 months, 12 months, etc.) so you can prepare for future growth.
- Troubleshoot server issues by pinpointing CPU usage, memory usage, and other metrics at the specific time of concern.
- Combine metrics data with repository history and log files to debug a single interface or the enterprise.
- Retrieve vital information
If you compare message volume with queue depths or CPU usage, you may observe that queue depths have increased 10% over the last two months but message volume has increased 50%. This tells you that the engine is running properly. If, however, you also notice that your CPU usage has increased to 90% during that same time you should consider updating hardware to meet the demands of the additional message volume.
 types of reports customers are finding success with:
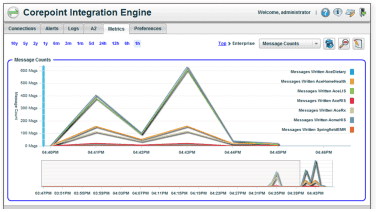
- message counts
- queue depths
- cpu usage
- memory usage
- adt and orm counts
- disk space free
- disk queue length
- msg cnts and cpu usage
- msg cnts and disk queues
- nisvc cpu vs. memory