As healthcare organizations share more health data, there often is a need for the interface team to demonstrate the organization’s downstream data flow. The recently-released version 6.0 of Corepoint Integration Engine includes a new graphing feature that allows IT staff to visually demonstrate to colleagues how complex action lists result in patient data arriving at the intended end point.
6.0 includes three different graphical views of interfaces: configuration graphing, data flow, and object graphs. Each graph helps interface managers quickly discover details about the system and plan efficient ways to create new interfaces. Users can also easily create new interfaces using the graphing feature. With the click of a button, you can add a connection that automatically implements best practices for adding an interface in that particular place in the organization’s data architecture. (continued below video)
Here are a few examples of how the new graphing feature in the engine demonstrates data workflow:
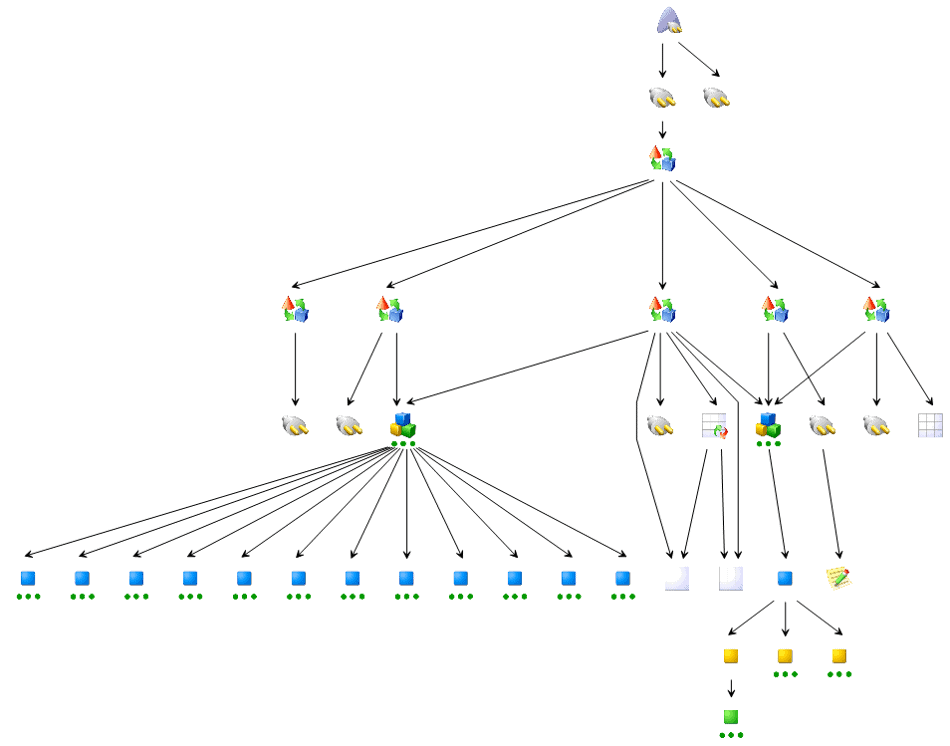
as hospitals and health systems begin to share more data with more applications, having a visual layout of how the data gets from point a to points d, e, and f can be extremely helpful, as demonstrated above. your health data environment may be complex, but tracking the message doesn’t have to be difficult.
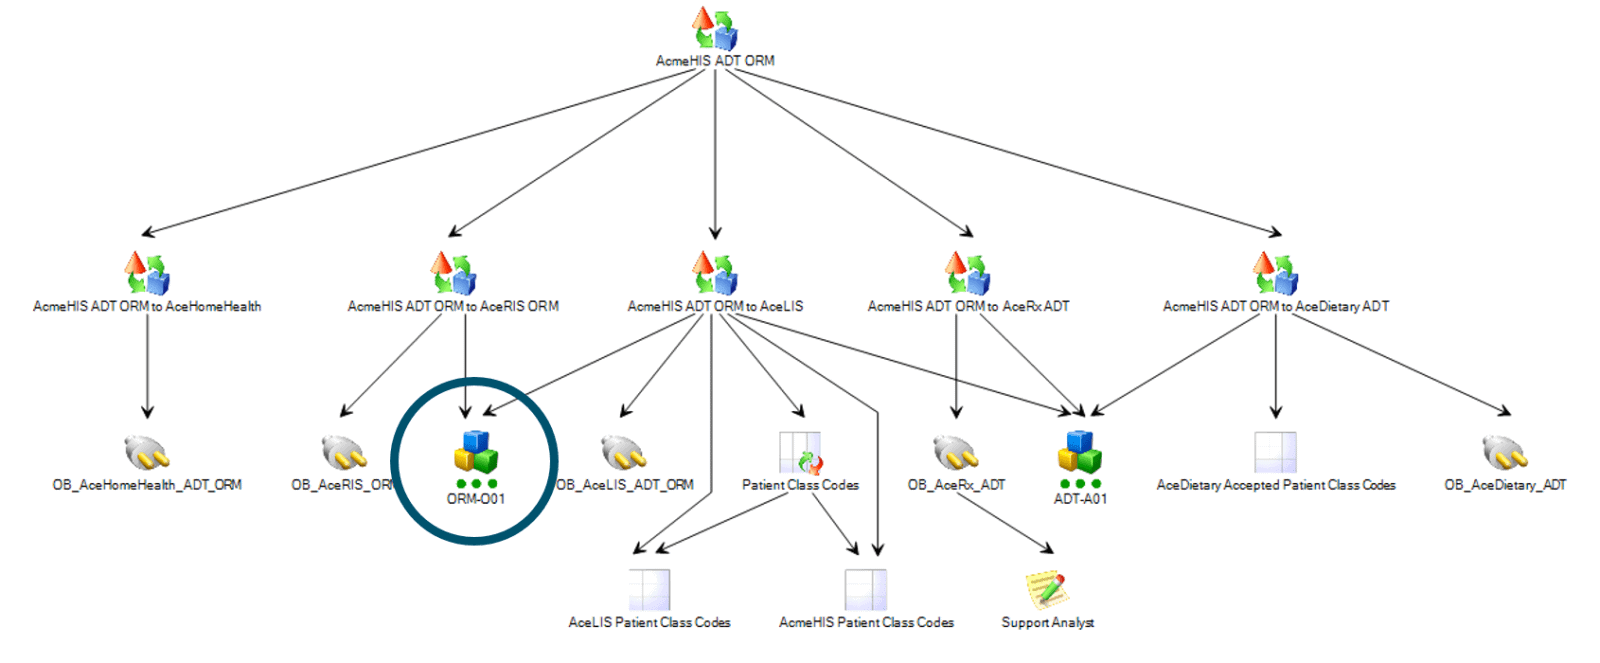
the workflow graphing feature gives users a contextual view of how a change to one hl7 message will affect other elements of your organization’s data flow. for example, if a change is made to the circled item above, then two action lists will need to be re-tested to ensure data continues to flow as intended.
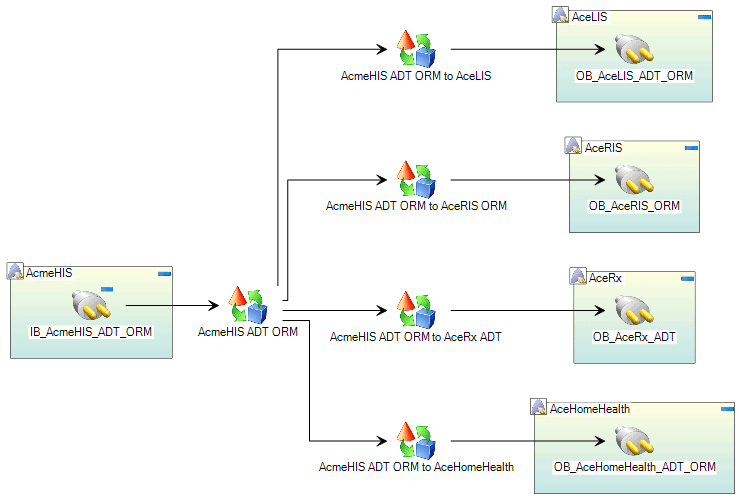
interface graphing also gives users the ability to visualize how messages flows through each interface.
to learn more about graphing and other new features in corepoint integration engine, such as audit logging, visit our take a tour page.