Dmitri Kitaynik, a program manager on our development team who helped introduce Monitor, describes below the rationale behind Monitor’s key features and how he envisions they will improve the daily activities of our valued customers.
Corepoint Health customers are encouraged to upgrade to version 7.0 to keep their use of Corepoint Integration Engine current and to reap the benefits of the new data exchange standards and product features. More details for download are available in Corepoint Health’s User Community.
What was your goal with the new Monitor?
Initial goal for the Monitor was very focused and simple –use technology that is open standard, has wide support, and has tools to deliver existing features that our customers use and love.
We identified HTML5 as that technology because we wanted Monitor to behave like a true web page, scalable to different browser sizes with the ability to open in multiple browser tabs.
Since this is completely unique and new to the engine, can you explain your development process?
Before a single line of code could be written, the development team worked on the concept design for Monitor pages. When I got together with the team we asked ourselves, ‘What should the Monitor be?’
Because we were doing a complete rewrite, we realized we had a unique opportunity to keep everything that is great about the existing Administration Console but apply knowledge that we gained from our customers over the years to create something even more useful. Instead of delivering a carbon copy of Administration Console in HTML, we wanted to deliver a superior product for our customers – one that could be scaled into the future.
Does Monitor have similarities to the Administration Console?
We wanted Monitor to present and optimize information around common workflows. It should be intuitive to use, easy to read and navigate, and deliver interface information at the customer’s fingertips. This should allow most customers to accomplish same tasks in Monitor more quickly than it was possible in the Administration Console.
Existing customers will find themselves right at home on Monitor’s Connection Table which displays connections in the trusted tabular format, similar to Administration Console. But with Monitor we didn’t stop there. We pursued a radically new way to visualize and navigate the existing connections – Connection Central.
 Click image to view full screen.
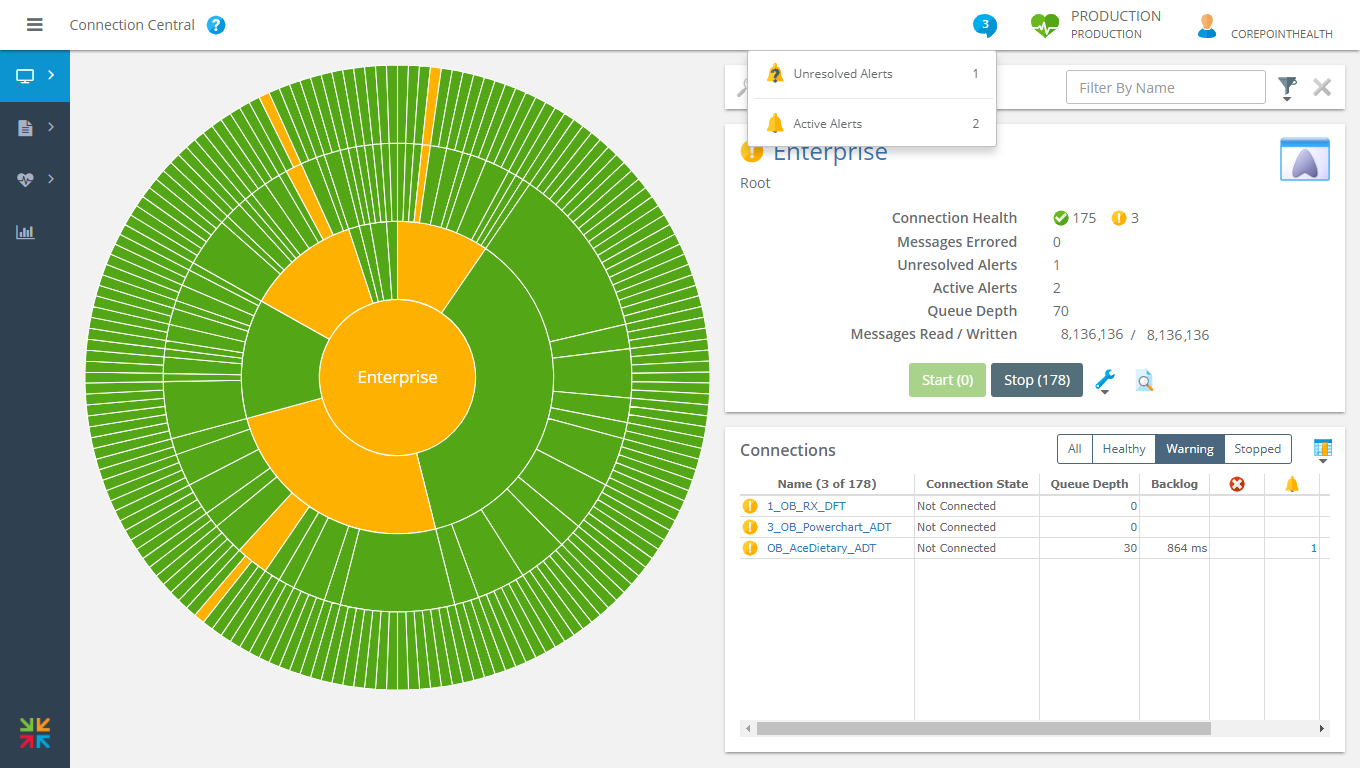
With Connection Central, we challenged ourselves to create a new graphical interface that would be easy to use yet useful at any size of configuration, from clinics to the largest IDN health systems anywhere. Connection Central is great for monitoring your interfaces and is really good at highlighting connections that are in trouble.
With Monitor we are also introducing unified health for connections, applications and other objects. If you have a connection that has a warning, its parent applications and organization will have a warning.
What are the real-world benefits of the new Connection Central view?
Connection Central presents an interactive, graphical view of the entire interface running on engine. This circular view shows all layers of configuration, from Enterprise in the center down to the individual connections on its outer ring. You can click on any application, organization or connection in the graph and it will zoom to that level of detail.
It’s important to note that customers don’t have to click on the interface to see the statistics. As you hover your mouse over any object in the graph, panel to the right will automatically show its summary, and may include: object type and name, connection health, connection state, messages erred, unresolved alerts, active alerts, queue depth, and messages read/written.
This is useful because customers now can see stats for an application group or an organization as a whole – providing a better overall view of message statistics at any level of your environment. Users also have the ability to visualize every connection in the same graph, which was not possible in the previous Admin Console.
How did moving to HTML5 technology change your approach?
Our development and design team took a holistic approach to delivering Monitor’s user experience. Individual pages were not designed in a vacuum – information displayed throughout pages is consistent and interlinked.
 Click image to view fullscreen
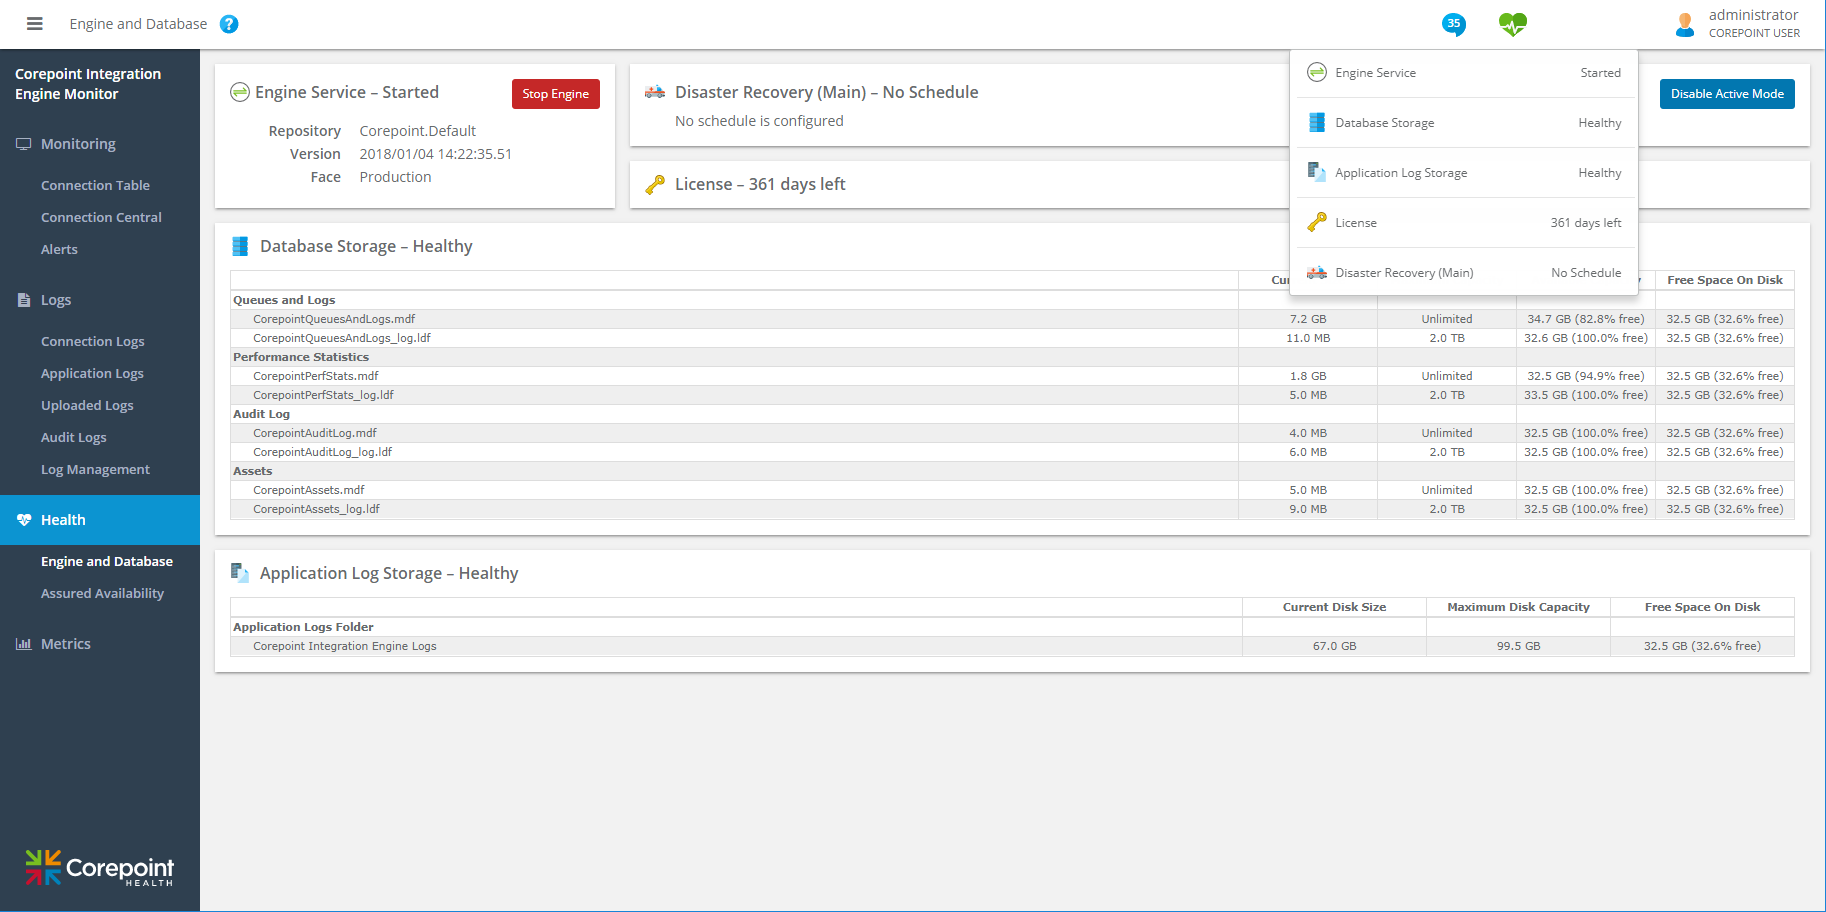
A distinct difference in Monitor from Admin Console is how information is delivered to the web browser. Admin Console pulled information from the engine at a fixed interval. In Monitor, we got rid of that countdown interval – information is now pushed to Monitor as needed. To ensure minimal possible footprint on the client network, we have optimized Monitor to update certain information, such as connection statistics, in near real time while other information that changes less frequently is not pushed as often.
The overall goal of Monitor is to deliver a unified, consistent experience to our customers in managing their interfaces and to deliver information about the state of interfaces that is easy to interpret. The fact that it looks great doesn’t hurt either.

The Data Flow view has some similarities to graphing in previous versions. What are the key differences in the new Monitor?
The main functionality has not changed, but the color around each connection now indicates its health, just like Connection Central and Table. This is aligned with our goal to have consistency throughout Monitor. If a connection has an issue, it will turn Yellow. Otherwise, everything users enjoyed about Data Flow in the prior versions of the engine is there. Users may notice a small change to the tool bar at the top of the Data Flow screen, but the tools and functions of each of the tools remain the same.
Interesting fact:
At first, performing a complete rewrite of the highly functioning and popular Admin Console sounded like a crazy idea, especially considering that Administration accounts for approximately one third of the Corepoint Integration Engine suite. However, with security being so important in healthcare, we knew we need to keep pushing forward with modern technologies. The new monitor has recently been tested for OWASP Application Security Verification Standard Level 1 testing, ensuring it meets the highest levels of security in the industry.